This analysis asks a simple question: are Americans in their 20s and early 30s forming businesses at higher rates than in the past? To answer it, we look at two things. First, the stock of self-employed workers in each age group as a share of all employed workers — a snapshot of who is self-employed right now. Second, the flow into self-employment: how many workers transition from wage employment into self-employment each month and year.
We organize the data into age bands (20–34, 35–44, 45–54, 55–64, and 20–64 overall). These are not strict generational boundaries; the goal is to track how self-employment patterns differ across life stages, not to make claims about Millennials or Gen Z as named generations. Where the data show interesting variation within the 20–34 band, we zoom in on the 20–29 group specifically.
Key Findings
Summary
- All five age cohorts are above their 2016–2019 self-employment share — the post-COVID recovery in self-employment participation is broad-based, not confined to any one group.
- Workers 20–34 show the most striking recovery, driven primarily by those 20–29. Their self-employment share has returned to the long-run 2005–2019 mean, a level not sustained since the dot-com era, reversing more than a decade of decline.
- The evidence for 20–34 points toward opportunity-driven entry rather than necessity. The rate at which employed workers are transitioning into self-employment has run at or above the top of its historical range for much of the post-COVID period — a sustained elevation not visible in older cohorts. The unemployment pathway is harder to read (low unemployment means a smaller, noisier denominator), but if anything the contrast reinforces the story: it is the 55–64 group, not the 20–34 group, that shows more post-COVID activity above its baseline in the unemployment channel, consistent with older displaced workers falling back on self-employment rather than younger workers choosing it.
- Durable formation rates are broadly at historical norms. Year-over-year entry rates (the most stable measure of lasting business formation) are near baseline for all cohorts. The elevated stock reflects accumulated entry over several years combined with solid persistence rates.
1 The Stock Recovery: All Cohorts Above Pre-COVID Baseline
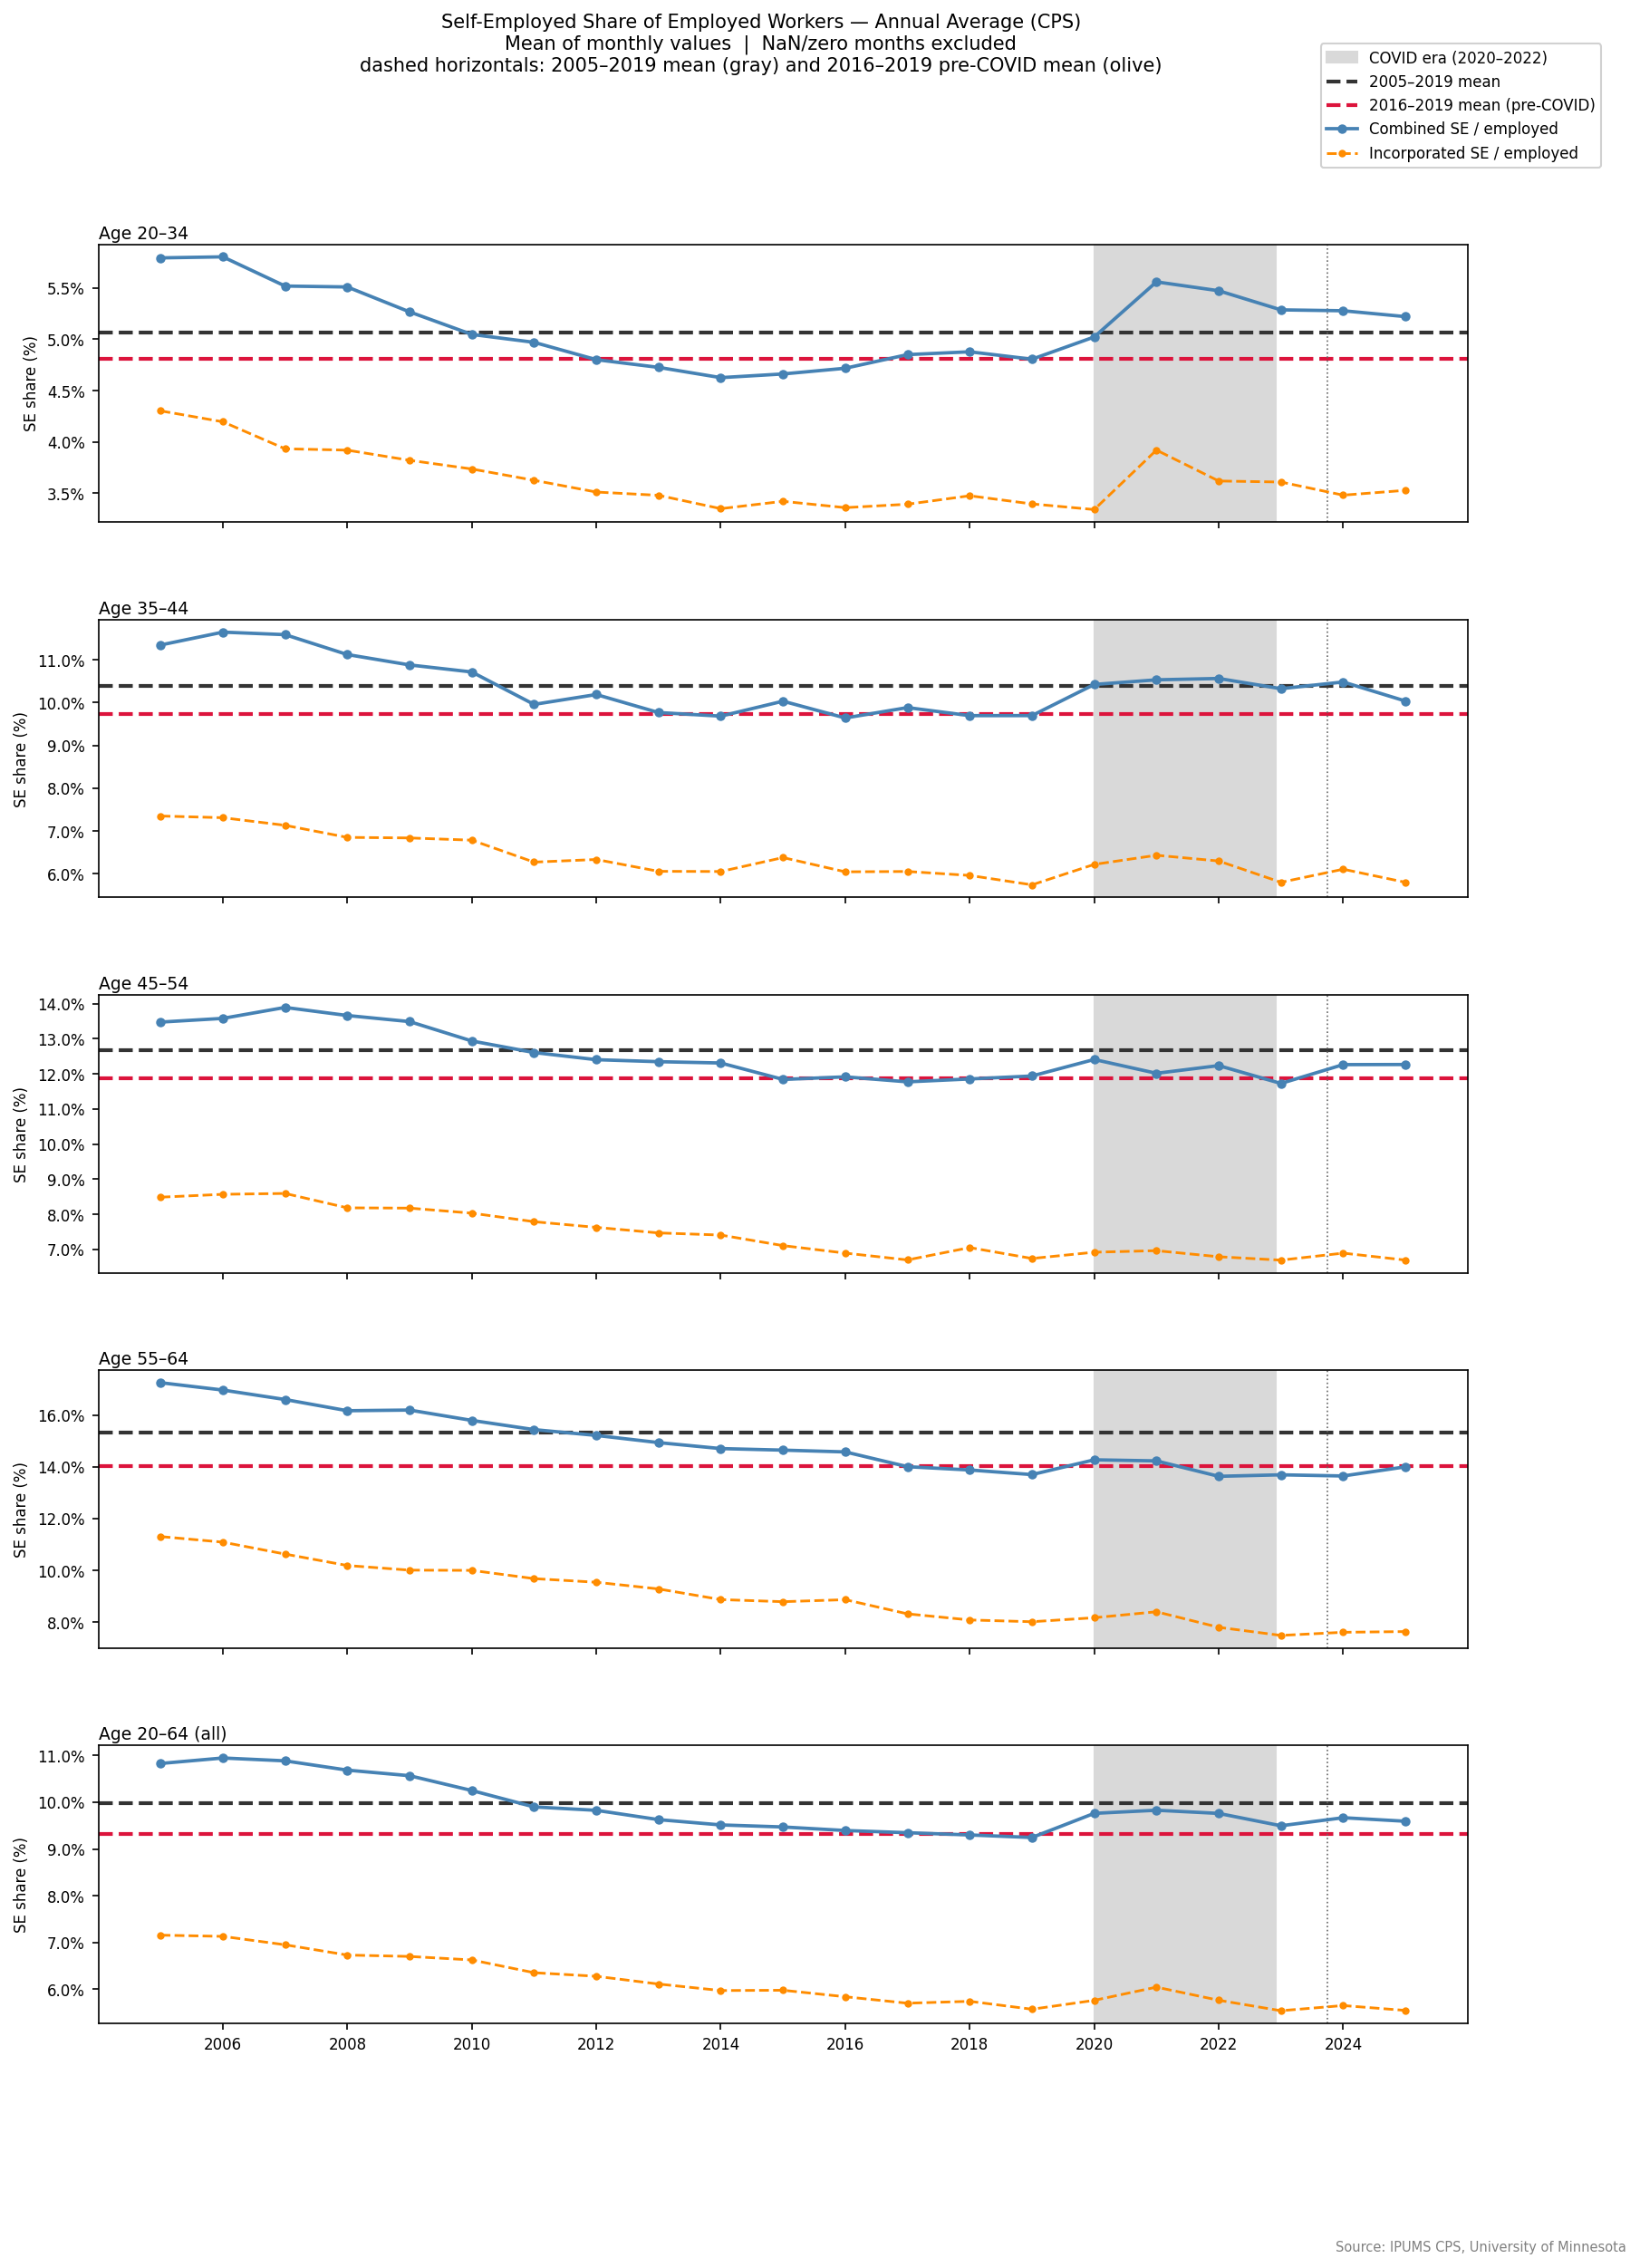
The share of employed workers who are self-employed fell steadily from the early 2000s through 2019 across every age group. The COVID-19 pandemic and its aftermath reversed that trend. As of 2024–2025, every cohort is above its 2016–2019 average and several are approaching or exceeding their long-run 2005–2019 mean.
Age 20–34: A Decade-Long Decline Reversed
The youngest cohort tells the clearest story. Their self-employment share declined from a peak near 5.5% in the early 2000s to a trough around 4.5% in the late 2010s, a 15-year erosion. Post-COVID, that decline has fully reversed. The 2023–2025 annual averages are above the crimson 2016–2019 reference line and tracking near the gray 2005–2019 long-run mean. This is the first sustained period above the pre-COVID baseline since the dot-com era. Within this cohort, it is the youngest workers, those 20–29, who show the sharpest elevation relative to their own historical baseline, suggesting they are the primary driver of the 20–34 signal.
Ages 35–64: Recovery, but From Lower Levels
Older cohorts saw a steeper long decline in self-employment share: 3–5 percentage points from 2004 to 2019 in the 45–54 and 55–64 groups. The post-COVID recovery is real but incomplete. All cohorts are above the 2016–2019 line, but still well below their 2004 peaks. The 55–64 group has recovered the most ground in absolute terms; the 35–44 group the least.
2 Opportunity, Not Necessity: The 20–34 Entry Pathway
Not all self-employment entry is equal. Workers pushed into self-employment by unemployment tend to form less durable, lower-quality businesses than those who leave stable employment by choice. The pathway into self-employment matters for interpreting the post-COVID picture.
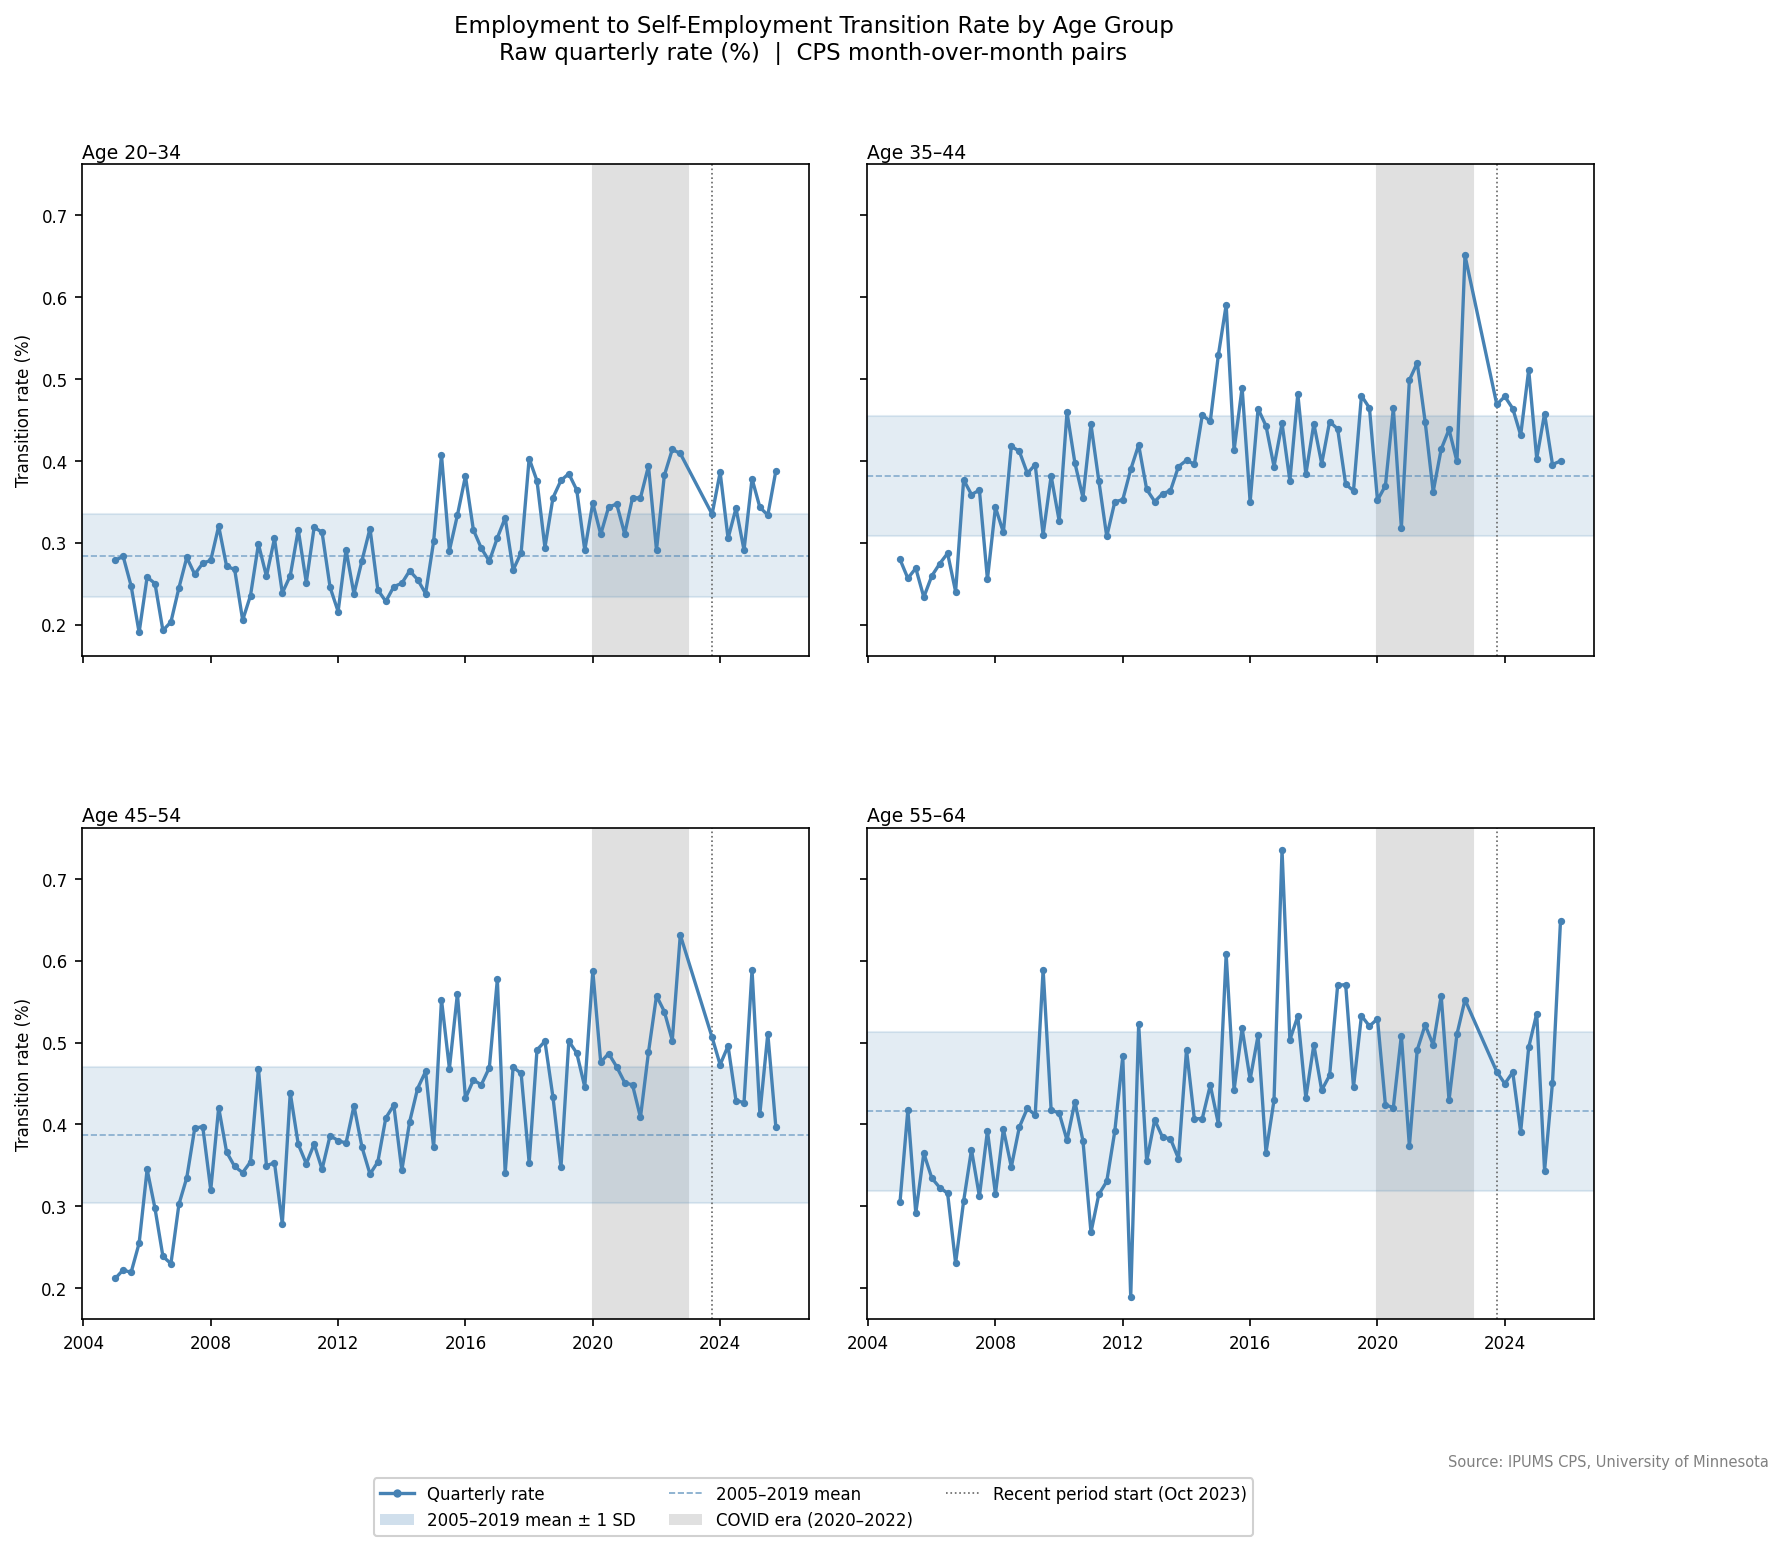
To distinguish the two, we compute separate quarterly transition rates from the CPS rotation structure:
- Employment to self-employment: share of employed wage-and-salary workers at month T who are self-employed at month T+1
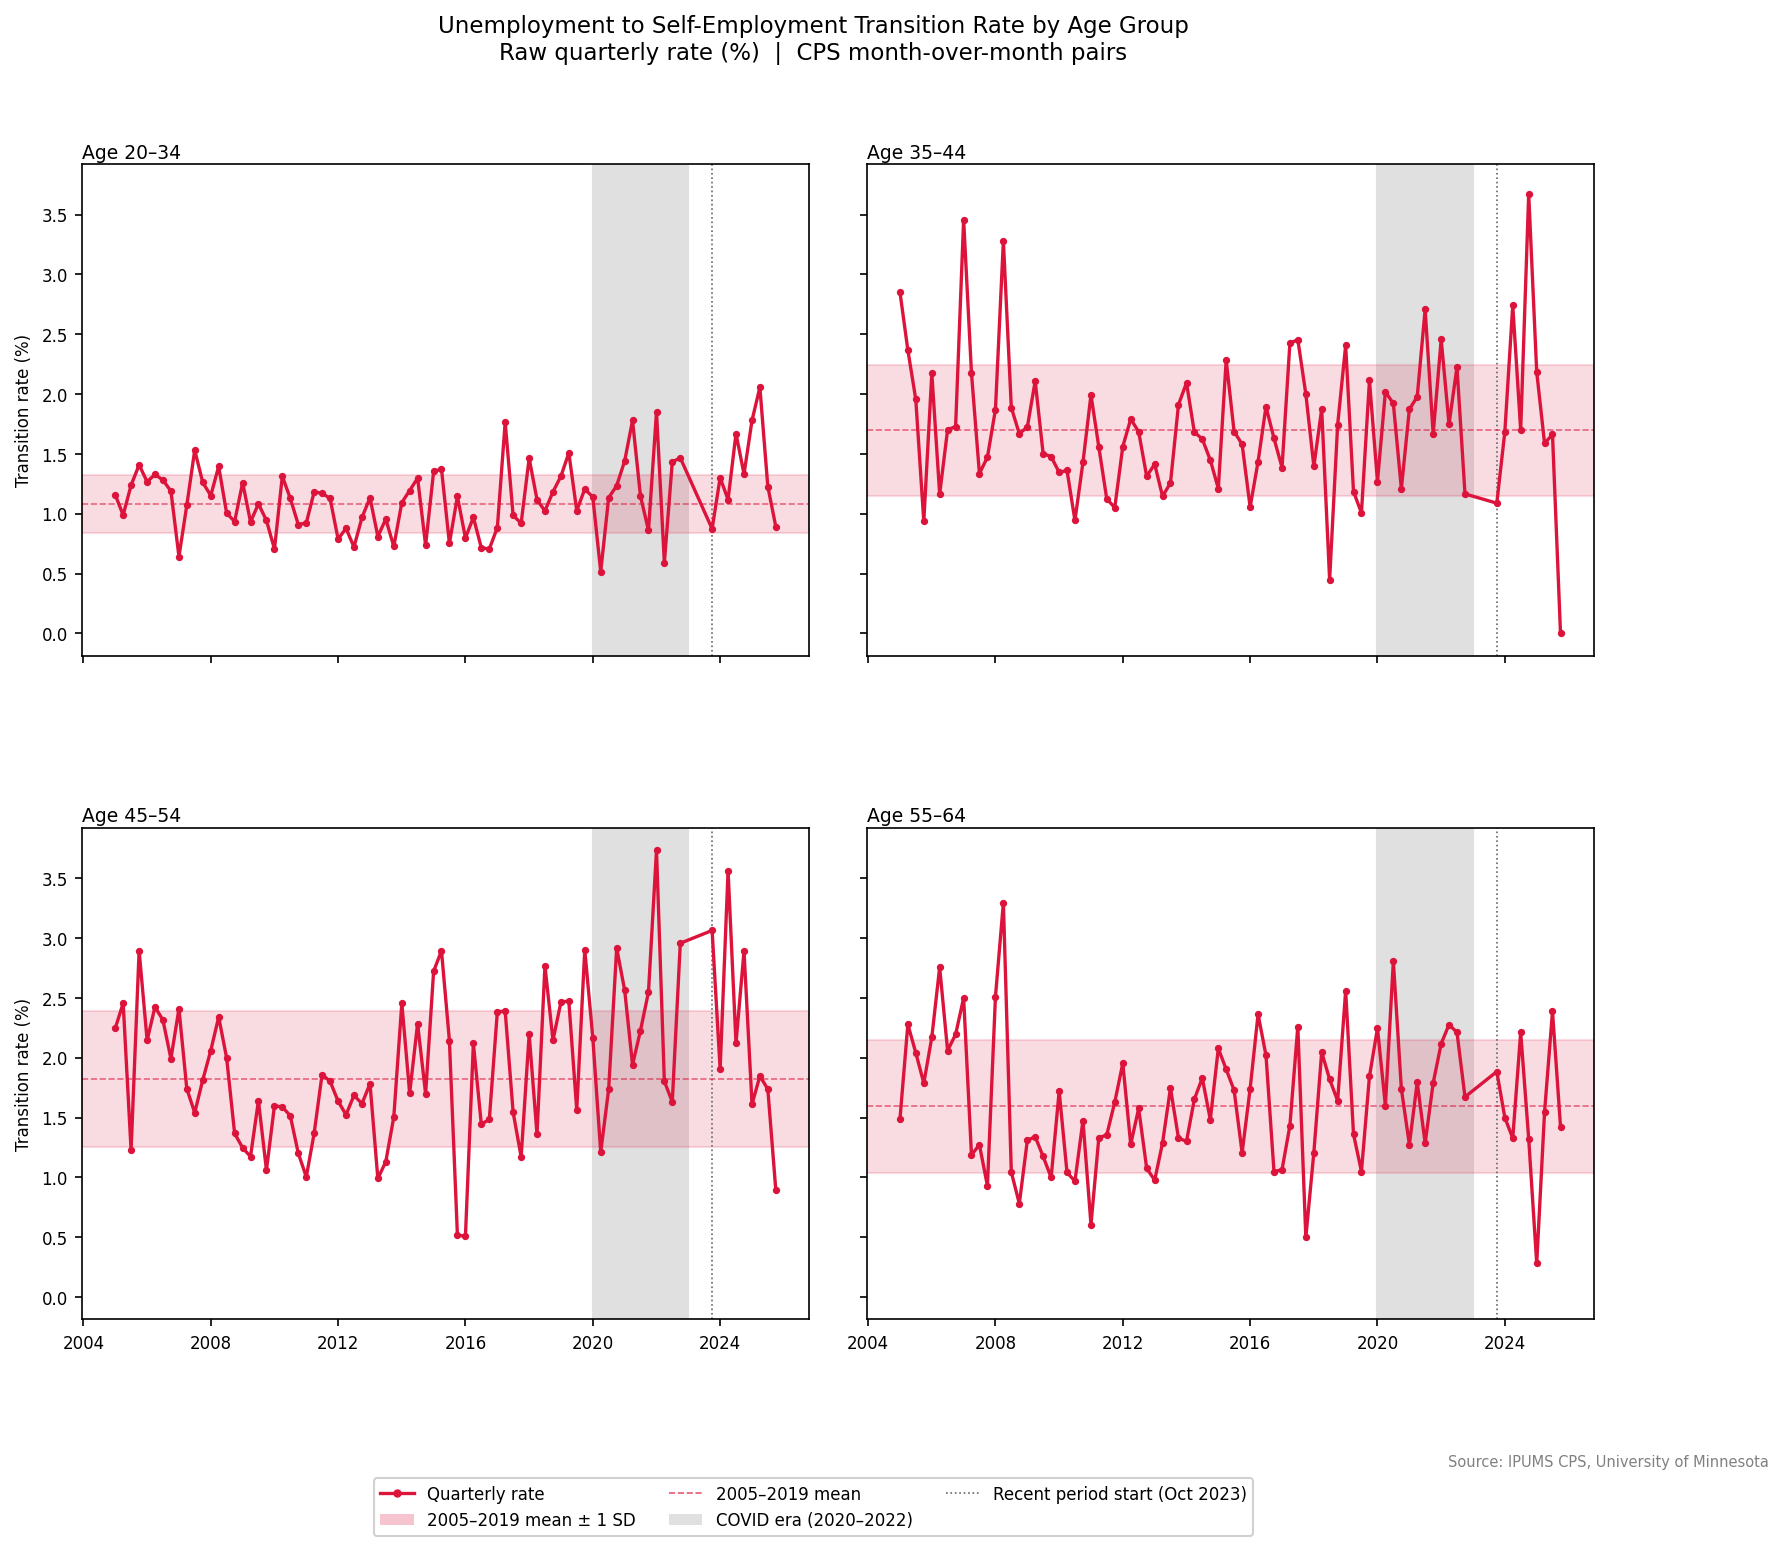
- Unemployment to self-employment: share of unemployed workers at month T who are self-employed at month T+1
Each panel shows the raw transition rate alongside the shaded 2005–2019 historical range (mean plus or minus one standard deviation). The y-axis is held constant across all four age groups so that absolute levels are directly comparable.
The employment channel is the cleaner signal
The 20–34 age group has a lower base rate of transitioning from employment to self-employment than older cohorts, which is not surprising given that older workers tend to have more capital, professional networks, and industry experience to draw on. What stands out is that the 20–34 rate has been running at or above the top of its historical range for much of the post-COVID period. That kind of persistent elevation is not visible in the same way for the 35–44, 45–54, or 55–64 groups, which look broadly flat relative to their own historical ranges.
The unemployment-to-self-employment channel is harder to read, for two reasons. First, unemployment has remained low since 2022, which means there are fewer unemployed workers in any given CPS rotation cohort to begin with. Fewer people in the denominator means wider swings in the rate even when nothing fundamental has changed. Second, the CPS rotation structure compounds this: only a fraction of respondents are in their matched month in any given quarter, further shrinking the pool. The wide historical bands in Figure 2b reflect both of these constraints.
With that caveat, the 55–64 panel is worth noting. It shows more post-COVID activity above its historical range than the other groups -- a tentative pattern that would be consistent with older workers displaced from jobs entering self-employment as an alternative to continued unemployment. This is the opposite of what we see for 20–34, and it is the kind of contrast that makes the opportunity story for younger workers more credible: the two age groups appear to be responding to different pressures. We hold this observation loosely given the noise, but it is worth watching.
Taken together, the pattern is consistent with opportunity-driven entry among younger workers: employed people with other options choosing self-employment, not unemployed people falling back on it.
3 Self-Employment Is Not Just a Cyclical Response
One natural question: is the post-COVID self-employment recovery simply a function of a tight labor market? The scatter plots below show that for most age groups, the historical relationship between the unemployment rate and the self-employment share is weak. None of the correlation coefficients are particularly strong, and the recent observations tend to cluster above the baseline trend regardless of age group, suggesting that the current self-employment share is higher than unemployment conditions alone would predict.
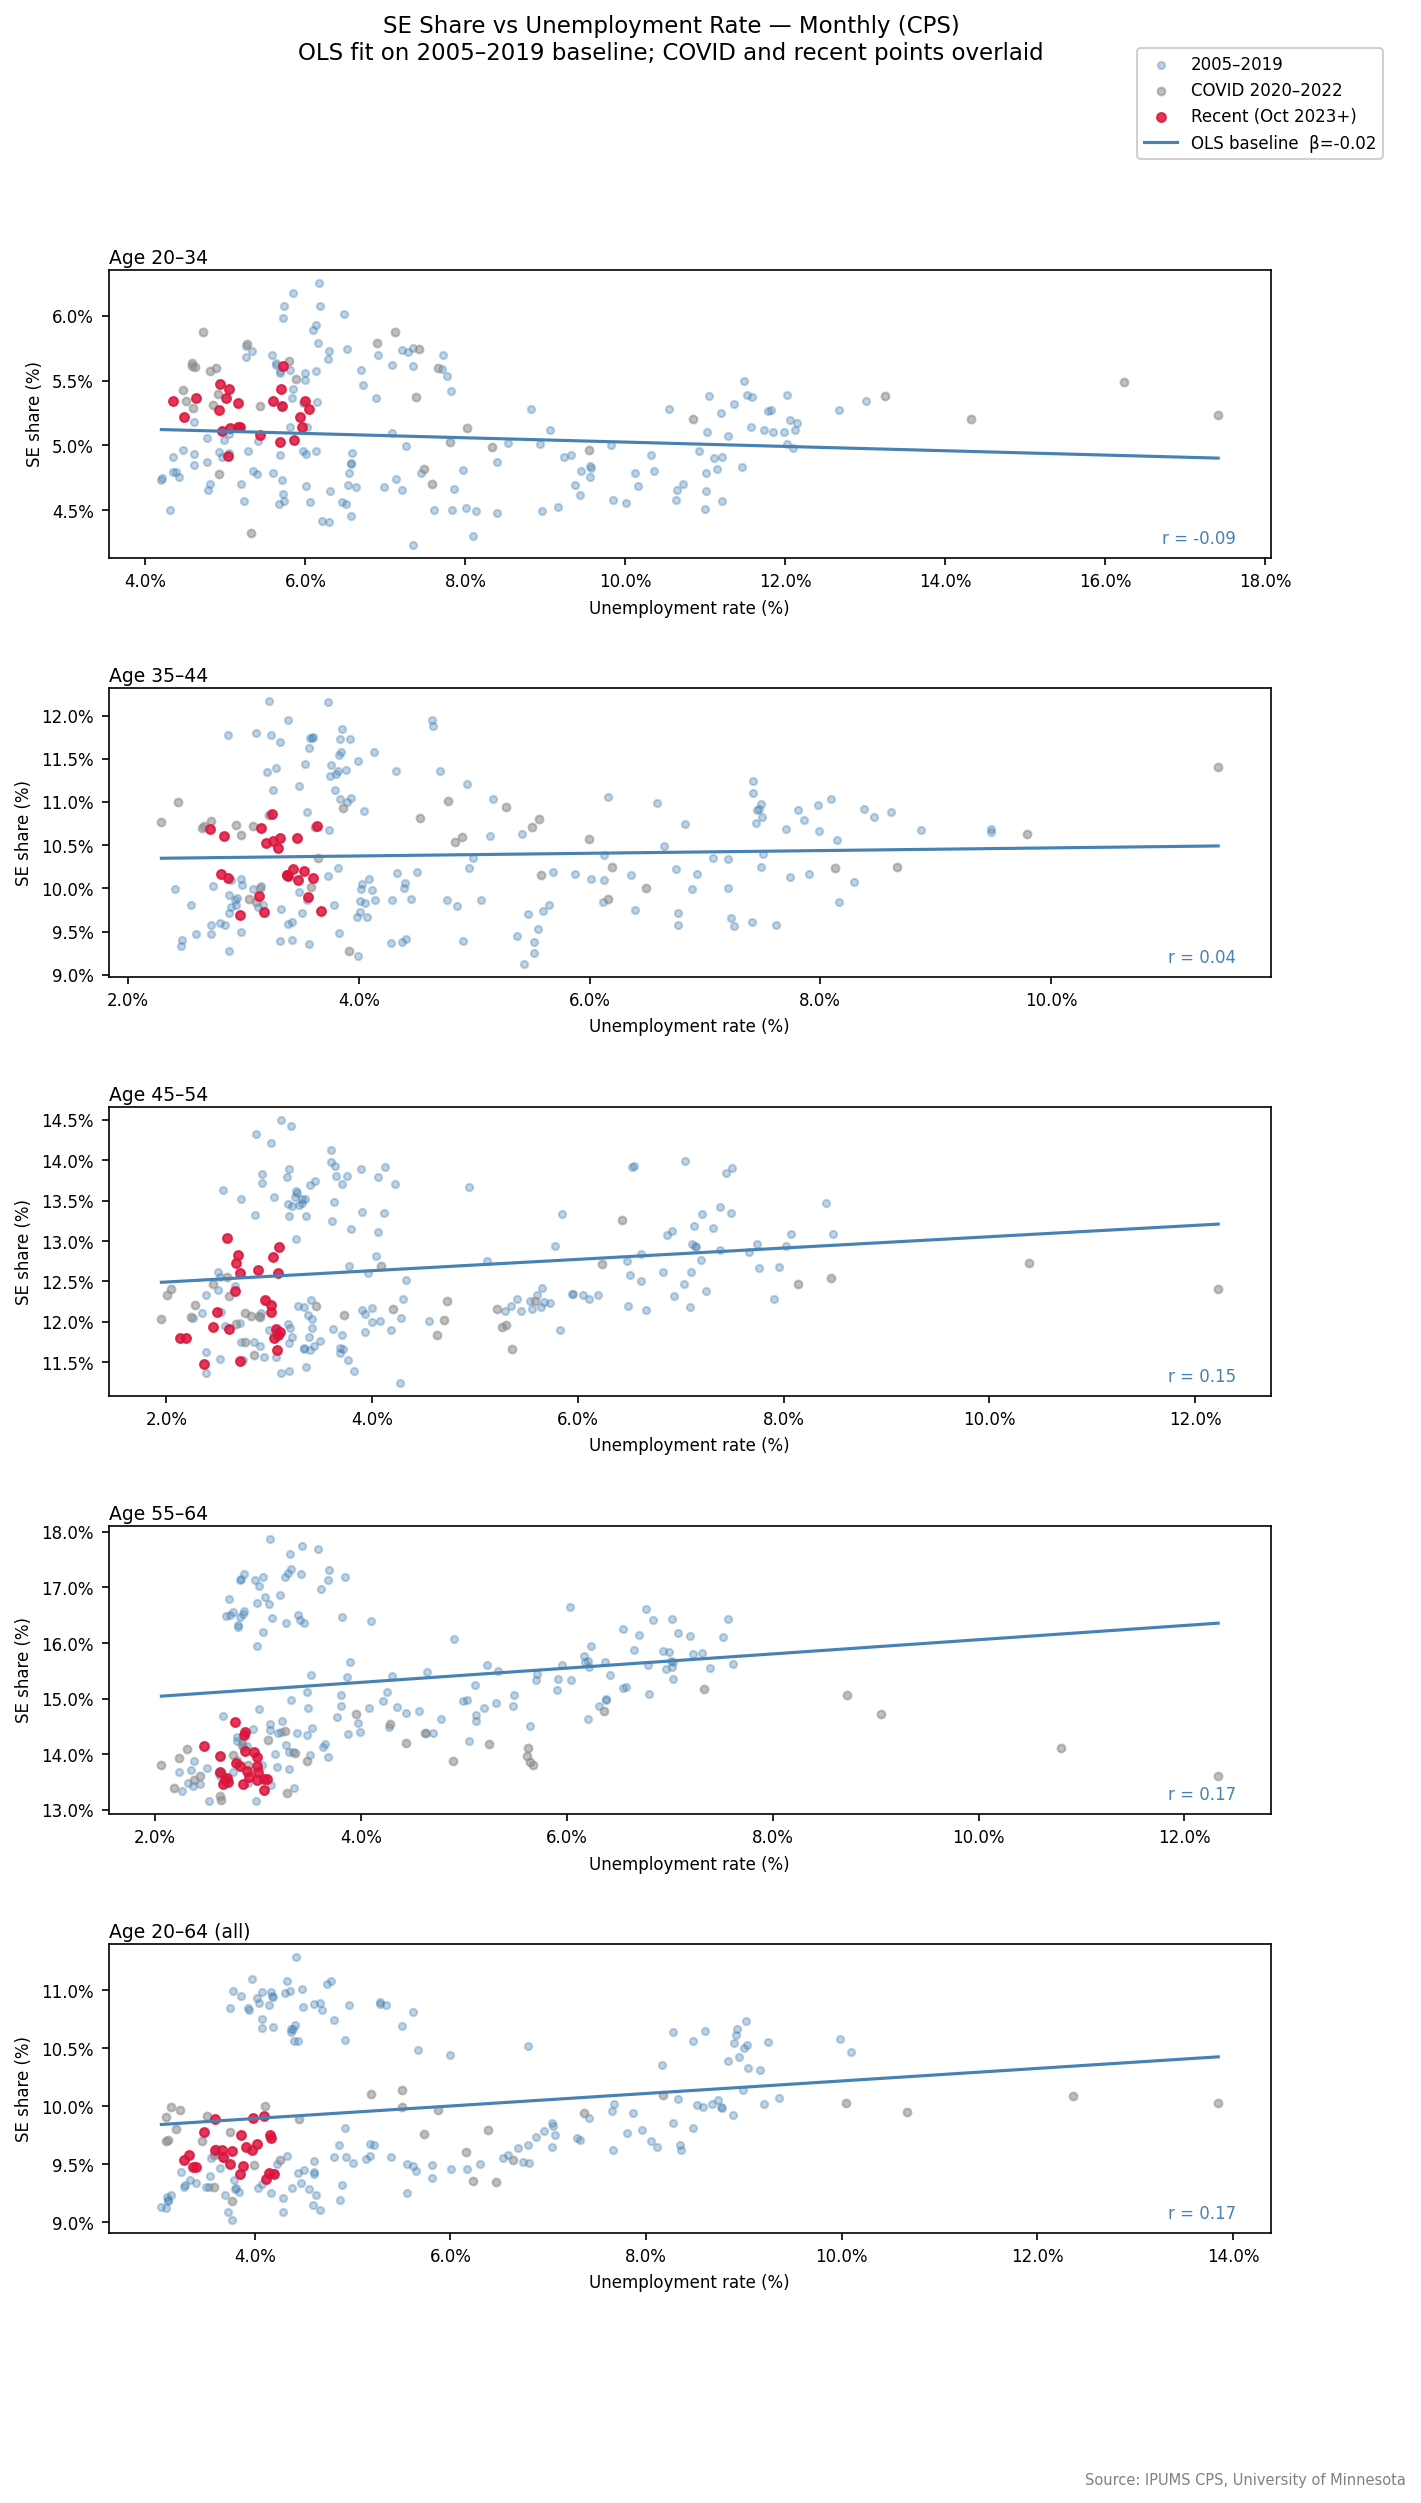
For the 20–34 cohort, the historical relationship between self-employment share and unemployment is essentially flat (r = −0.09, β = −0.09) — self-employment participation in this age group was never strongly cyclical. The recent crimson points cluster above the OLS baseline, meaning the current self-employment share is higher than the historical unemployment rate alone would predict.
Older cohorts show the expected positive correlation (higher unemployment tends to push up necessity self-employment), but even there, the recent post-COVID points do not fall neatly on the baseline relationship in a way that would make the recovery look purely mechanical.
4 Flow Rates: Entry Is Near Historical Norms
The stock analysis above measures who is self-employed at a point in time. The flow analysis measures who enters self-employment. We use two methods from the CPS rotation structure:
- Month-over-month: tracks person transitions between consecutive survey months. Captures rapid and gig-economy entry; higher volatility.
- Year-over-year: matches the same person at MISH 4 and MISH 8 (roughly 12 months apart). Captures durable business formation; lower volatility but carries a roughly 15-month publication lag.
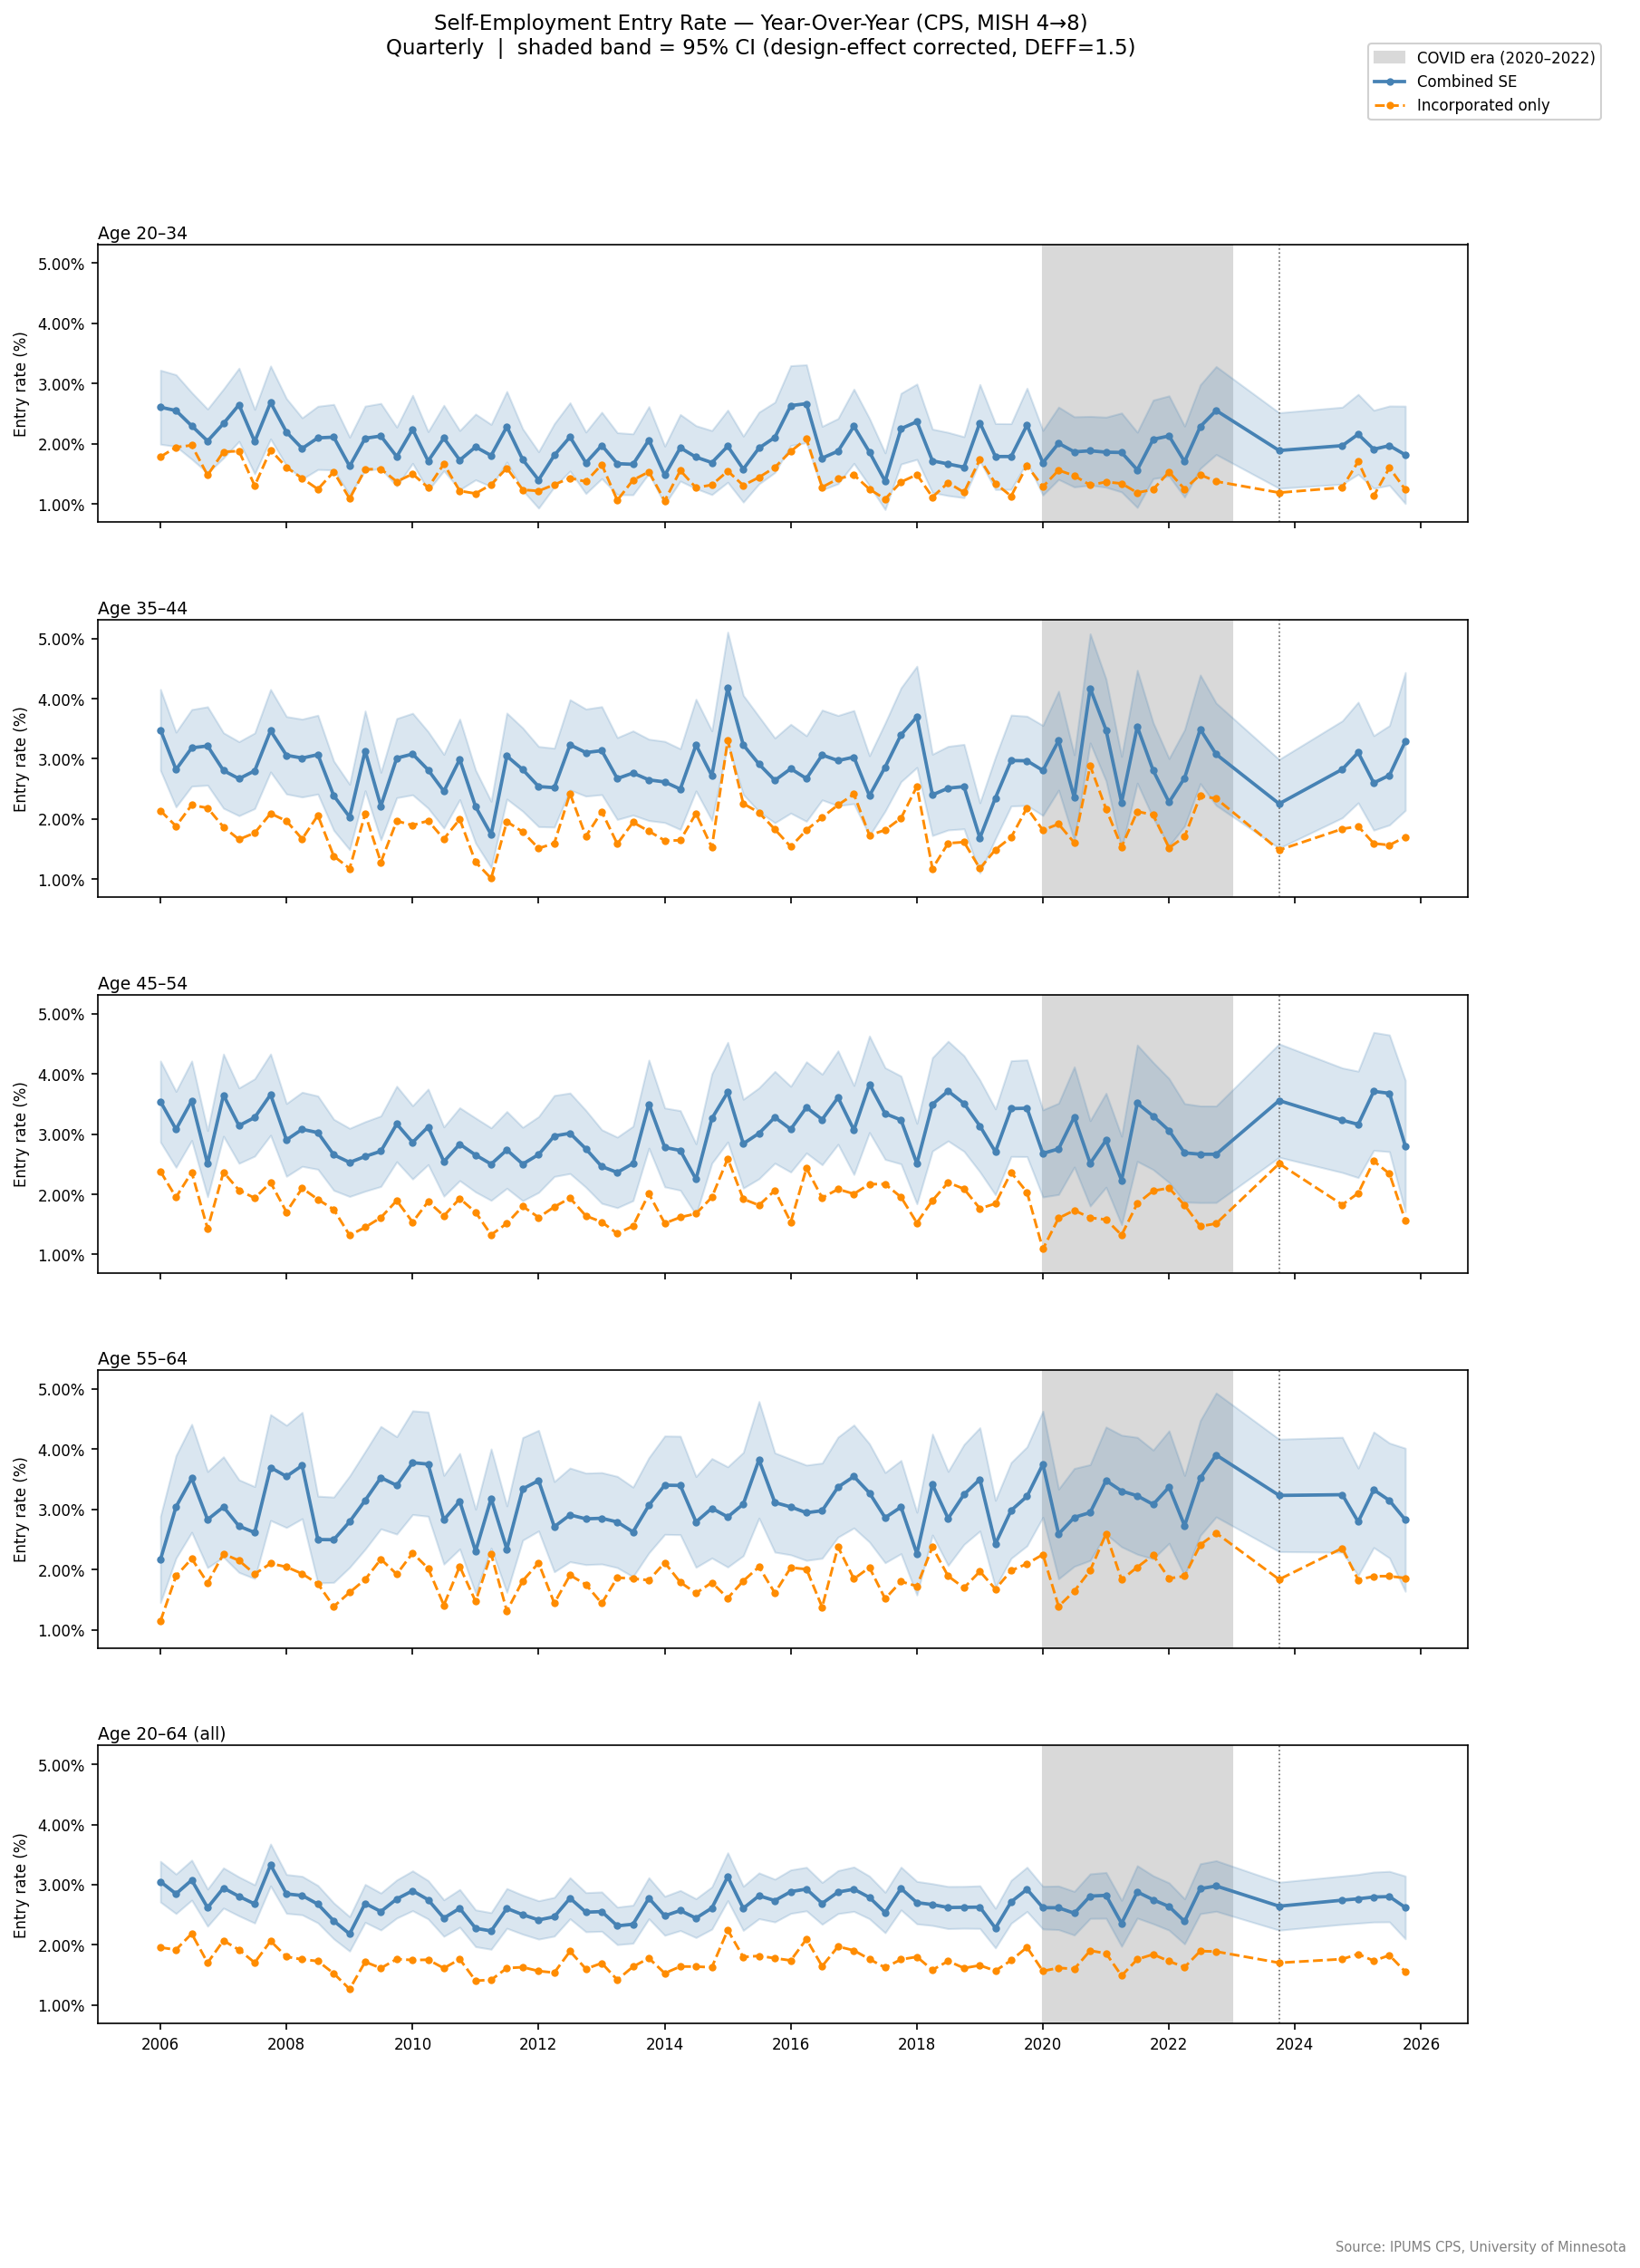
Year-over-year entry rates are broadly at or near historical baseline for all cohorts. There is no dramatic spike in durable new business formation. The elevated stock is better explained by the compounding effect of several years of flows that are modestly above (or at) their pre-COVID trough, combined with solid persistence rates (the fraction of self-employed workers who remain self-employed 12 months later).
Month-over-month rates for 20–34 show more individual months above their seasonal baseline, particularly in 2024, but the year-over-year series, which filters out short-lived or abandoned attempts, is more muted. Where month-over-month is elevated but year-over-year is not, the signal is workers testing self-employment rather than committing durably. Narrowing to the 20–29 sub-cohort, the year-over-year entry rate sits approximately 7% above its own 2005–2019 baseline mean, a stronger signal than the broader 20–34 group, which sits near its historical average.
Methodology
Data source
U.S. Census Bureau & Bureau of Labor Statistics, Current Population Survey (CPS) basic monthly microdata, 2005–2025. Accessed via IPUMS CPS, University of Minnesota.Self-employment definition
CLASSWKR = 13 (incorporated) or 14 (unincorporated). Combined self-employment and incorporated-only tracks reported separately throughout. Stock counts include all employed workers (EMPSTAT 10 or 12).Matching
Persons matched on CPSIDP across rotation positions. Month-over-month: consecutive MISH values within a rotation stint. Year-over-year: MISH 4 to MISH 8 (roughly 12 months). Matches validated on age (±1 year) and sex.Entry rate
Follows Kauffman New Entrepreneur Rate: (weighted count of employed non-self-employed at T₀ who are self-employed at T₁) divided by (weighted count of employed non-self-employed at T₀). Year-over-year weight: LNKFW1YWT. Month-over-month weight: WTFINL at T₀. Incorporated-only entry rate uses strict definition (not self-employed at all at T₀), excluding unincorporated-to-incorporated legal restructurings. Hours-worked filter (≥15 hrs/week) not applied; UHRSWORKT absent from extract.Baseline period
2005–2019 (primary). This window spans two full economic cycles, from the dot-com recovery through the Great Recession and the subsequent expansion, giving a stable long-run reference that is not distorted by the pandemic or the unusually tight pre-pandemic labor market. It follows Kauffman Foundation practice for the New Entrepreneur Rate. The 2016–2019 window is used as a closer, pre-COVID reference. COVID years (2020–2022) are excluded from all baseline calculations. Recent window: October 2023 onward.Confidence intervals
Normal approximation with design-effect scalar DEFF = 1.5, applied as SE = √(DEFF · p(1−p)/n). Conservative scalar for CPS stratified cluster sampling; PSU/stratum variables not in extract. "Above baseline" flags use a 95% threshold (|z| > 1.96) against the 2005–2019 seasonal mean; Newey-West autocorrelation-corrected z-scores also computed for inferential comparisons.
Primary data citation:
Sarah Flood, Miriam King, Renae Rodgers, Steven Ruggles, J. Robert Warren,
Daniel Backman, Annie Chen, Grace Cooper, Stephanie Richards,
Megan Schouweiler, and Michael Westberry.
IPUMS CPS: Version 12.0 [dataset].
Minneapolis, MN: IPUMS, 2024.
https://doi.org/10.18128/D030.V12.0
Underlying survey:
U.S. Census Bureau and U.S. Bureau of Labor Statistics.
Current Population Survey.
Washington, DC: U.S. Census Bureau.
census.gov/programs-surveys/cps
Methodological reference:
Kauffman Foundation. New Employer Business Rate.
Kansas City, MO: Ewing Marion Kauffman Foundation.